The Cotswold limestone beneath Oxford looks solid from the surface. That assumption can be costly. Weathered horizons, dissolution features, and buried channels in the gravels create abrupt velocity contrasts that only seismic tomography captures clearly. A standard borehole gives you a point. Tomography gives you the continuous profile between. In our track record, the river terrace deposits along the Thames and Cherwell mask deeper irregularities—paleochannels filled with soft alluvium that refraction surveys reveal in cross-section. When foundation loads must transfer to the unweathered limestone at depth, knowing exactly where that competent layer dips or fractures changes the piling design. We combine P-wave refraction with MASW when shear-wave velocity profiles are needed for stiffness correlation, and we often parallel the survey with CPT testing to calibrate seismic boundaries against direct penetration resistance in the gravelly soils common around Oxford's historic centre.
Seismic tomography turns a handful of borehole logs into a continuous subsurface image—essential where Oxford's limestone roof can vanish into a dissolution hollow without surface expression.
Methodology applied in Oxford
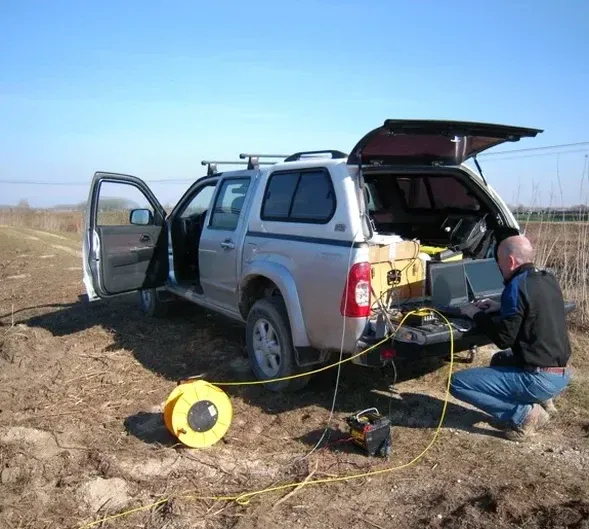
Procedure video
Local geotechnical conditions in Oxford
The error we see repeatedly in Oxford is mistaking a thin limestone stringer for the main competent bed. A developer drills three boreholes, hits rock at 6 metres in all of them, and proceeds with shallow pad foundations—only to find the rock was a 1-metre-thick isolated lens with 8 metres of soft clay beneath it. Seismic tomography would have caught that: the velocity contrast between a thin lens and a thick massive unit looks entirely different in a tomogram. Another failure pattern involves undetected dissolution cavities in the limestone. A void just 2 metres across can compromise a pile toe if the pile lands on a thin roof spanning it. Reflection profiling and careful velocity analysis flag these low-velocity anomalies before the piling rig arrives. Ignoring the velocity gradient within the Oxford Clay itself is also risky—its undrained shear strength correlates with seismic velocity, and a low-velocity band near the surface often means softened, overconsolidated clay that will settle more than expected under load.
Our services
Our seismic tomography work in Oxford covers two distinct acquisition geometries, each suited to different geological targets and site constraints. Both methods produce velocity models that feed directly into geotechnical design parameters.
Seismic Refraction Tomography
The primary method for mapping depth to bedrock and identifying lateral velocity variations. We deploy a linear geophone spread and record first-arrival travel times from multiple shot points. Tomographic inversion produces a 2D velocity cross-section. In Oxford, this works well across the gravel–clay–limestone sequence because each unit has a distinct seismic velocity. We process with iterative ray-tracing algorithms that handle the strong velocity inversions sometimes present when cemented gravel overlies softer clay. Output includes interpreted geological boundaries and rippability assessments for excavation planning.
Seismic Reflection Profiling
Applied where deeper targets or sharper interfaces dominate the site investigation. Reflection surveys use common-midpoint (CMP) acquisition and stacking to image impedance contrasts at depths beyond the reach of refraction—50 metres or more in favourable conditions. In Oxford, this technique excels at mapping the base of the Oxford Clay and the top of the Great Oolite Group where a strong acoustic contrast exists. It also detects fault offsets in the limestone that refraction smoothing might obscure. Processing includes velocity analysis, NMO correction, and migration to collapse diffraction hyperbolae from karst edges.
Quick answers
What depth can seismic tomography reach in Oxford's geology?
Refraction surveys with a sledgehammer source typically resolve 15 to 30 metres in Oxford's gravel and clay terrain. With an accelerated weight drop or small explosive charge, penetration exceeds 50 metres. Reflection profiling reaches deeper—100 metres or more—provided the acoustic impedance contrast is sufficient. The limestone–clay interface usually generates a strong reflection. In practice, depth is limited more by site geometry than by source energy: urban Oxford sites with restricted spread lengths constrain the maximum depth of investigation.
Can seismic tomography detect voids or dissolution features in the limestone?
Yes, though with important caveats. A gas- or sediment-filled cavity produces a localised low-velocity anomaly that tomographic inversion can resolve if the void is larger than roughly one-quarter of the geophone spacing. Reflection profiling picks up the diffraction hyperbola at the void edge. The method does not detect every small fissure—no geophysical technique does—but it reliably flags voids of engineering concern. We recommend combining tomography with targeted borehole verification if karst features are suspected.
How much does a seismic tomography survey cost in Oxford?
For a typical site investigation in Oxford, seismic tomography surveys range from £2,250 to £4,060 depending on the array length, target depth, and whether refraction alone or combined refraction–reflection is required. A 48-channel refraction line with full tomographic processing sits near the midpoint of that range. Adding reflection profiling with CMP acquisition increases the cost. Site access, traffic management on Oxford's narrow streets, and ground conditions also influence the final figure. We deliver a fixed-price proposal after reviewing the site plan.
How does seismic tomography compare to boreholes for site investigation?
They answer different questions. A borehole gives you precise stratigraphy, sampling, and laboratory testing at one location. Seismic tomography gives you the geometry between boreholes—continuous lateral coverage. The best Oxford site investigations combine both: boreholes for ground-truthing and geotechnical parameters, seismic lines to interpolate between them and to spot anomalies a borehole grid might miss. We also use the seismic velocity model to estimate rippability and to guide the placement of supplementary investigation points.